Welcome to the 13th edition of defined contribution (DC) trust, our annual statistics publication. It provides a high-level snapshot of the current landscape of occupational DC trust-based pension provision in the UK, including information on the number, memberships and assets of schemes.
Published: January 2023.
Our DC trust universe can be segmented into three high-level categories:
- DC sections of hybrid dual-section schemes (schemes with two sections - one offering DC benefits and the other offering DB benefits). We will refer to these as 'hybrid schemes'.
- Non-hybrid micro DC schemes (schemes with two to 11 members). We will refer to these as 'micro schemes'.
- Non-hybrid DC schemes (schemes with 12 or more members). We will refer to these as 'non-micro schemes'.
We have categorised the DC trust universe as such because the data we hold for each category are different. We do not report on assets held in DC sections of hybrid schemes or micro schemes as their reporting requirements in the scheme return are different from those for non-micro schemes.
This year’s edition covers around 26,990 current schemes from the pension schemes register as at 31 December 2022. Of the 25,700 schemes with fewer than 12 members, 21,580 (84%) identified themselves as a relevant small scheme (RSS) or an executive pension plan (EPP).
As with last year’s release, we’ve included similar snapshot data from earlier versions of our database. These form a consistent time series, each with an effective date of 31 December, between 2012 and 2022 (where data have been provided). Year-on-year figures may vary very slightly across publications, as late submissions are received and data coverage is enhanced between publication dates.
You can save the contents of this page as a PDF using your web browser. Open the print options and make sure the destination/printer is set as 'Save as PDF':
Executive summary
In this year’s statistics release, we describe the collection methods for the data contained in the annex to this publication, together with information on what is covered by each section of the annex.
- Section 1 (schemes), 2 (memberships), and 3 (finances) are based on schemes with 12 or more members (except for Table 1.1 in section 1, which is based on all schemes with two or more members).
- Section 4 (AE schemes) is based on all schemes with two or more members.
- Section 5 (micro schemes) is based on schemes with two to 11 members.
- Section 6 (effective date information) shows relevant effective date information.
The source tables referred to in this bulletin can be found in the annexure.
Key findings
Schemes
- There are 26,990 schemes (see Table 8 below), of which 21,580 (80%) have identified themselves as RSS or EPP (Table 5.4).
- In the last year, the DC market has been subject to further concentration.
- The total number of micro and non-micro schemes (excluding hybrid schemes) has declined by 2% (Table 1.19 and 5.1).
- The total number of non-micro schemes, including hybrid schemes, has declined by 11% (Table 1.2 and Figure 1 below).
- Since the beginning of 2012 the number of non-micro schemes, including hybrid schemes, has declined by 67% (from 3,660 to 1,220) (Table 1.2 and Figure 1 below).
- There are 36 authorised master trusts, accounting for 23.7 million DC memberships, including hybrid schemes, and over £105.3 billion in assets, excluding hybrid schemes (see Table 10 below).
- The use of default investment strategies for non-micro schemes excluding hybrid schemes has remained relatively stable over the last year: 51% of schemes, and 76% of open schemes use a default investment strategy (Table 1.9).
Figure 1: Occupational DC schemes by membership size group (including hybrid schemes) (2012 to 2023)
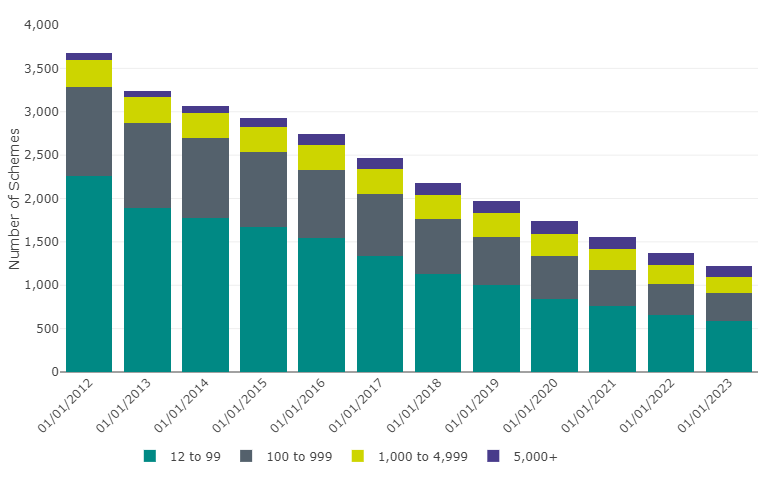
Since the beginning of 2012, the total number of non-micro schemes and hybrid schemes has declined by 67% from 3,660 to 1,220.
Table 1: Data underlying Figure 1, pertaining to occupational DC schemes by membership size group (including hybrid schemes) (2012 to 2023)
| Date | 12 to 99 | 100 to 999 | 1,000 to 4,999 | 5,000+ | Total |
|---|---|---|---|---|---|
| 01/01/2012 | 2,260 | 1,030 | 310 | 80 | 3,660 |
| 01/01/2013 | 1,890 | 980 | 300 | 70 | 3,240 |
| 01/01/2014 | 1,780 | 920 | 290 | 80 | 3,080 |
| 01/01/2015 | 1,670 | 870 | 290 | 100 | 2,930 |
| 01/01/2016 | 1,540 | 790 | 290 | 120 | 2,740 |
| 01/01/2017 | 1,340 | 710 | 290 | 130 | 2,470 |
| 01/01/2018 | 1,130 | 630 | 280 | 140 | 2,180 |
| 01/01/2019 | 1,000 | 560 | 270 | 140 | 1,980 |
| 01/01/2020 | 840 | 500 | 250 | 150 | 1,740 |
| 01/01/2021 | 760 | 420 | 240 | 140 | 1,560 |
| 01/01/2022 | 660 | 360 | 210 | 140 | 1,370 |
| 01/01/2023 | 590 | 320 | 180 | 130 | 1,220 |
Source(s): TPR: DC Trust: Presentation of scheme return data 2022 to 2023 (Table 1.2)
Memberships
The following figures all pertain to micro schemes and / or non-micro schemes, but not hybrid schemes:
- 69% of all private sector workplace pension memberships (including active, deferred and pensioner) are in a micro scheme or a non-micro scheme (see Table 8 below).
- 87% of all those currently saving (active memberships) are investing into a micro scheme or a non-micro scheme (see Table 8 below).
- Memberships of non-hybrid DC master trusts have increased from 270,000, at the beginning of 2012, to just over 23.5 million this year (Table 2.17).
- 97% of memberships in non-micro schemes are invested in the scheme’s default investment strategy (Table 2.13).
- The number of memberships in non-micro schemes that retired increased by 24% between the end of 2021 and 2022 from 151,000 to 187,000 (Table 2.16).
The following figures all pertain to non-micro schemes and hybrid schemes:
- Scheme memberships have increased by 13% over the past year, compared to 8% the previous year, and 1069% since the beginning of 2012 (Table 2.1 and Figure 2 below).
- In the past year, deferred memberships have increased by 15%, while active memberships have increased by 10%. (see Tables 2.3 and 2.2).
Figure 2: Memberships of occupational DC schemes by membership size group (including hybrid schemes) (2012 to 2023)
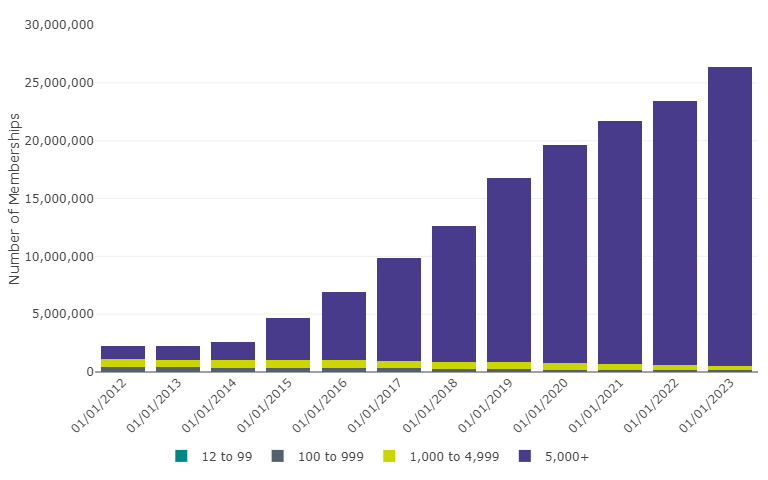
Membership in non-micro schemes increased by 13% over the past year (compared to 8% last year), and increased by 1069% since the beginning of 2012.
Table 2: Data underlying Figure 2, pertaining to memberships of occupational DC schemes by membership size group (including hybrid schemes) (2012 to 2023)
| Date | 12 to 99 | 100 to 999 | 1,000 to 4,999 | 5,000+ | Total |
|---|---|---|---|---|---|
| 01/01/2012 | 78,000 | 358,000 | 660,000 | 1,159,000 | 2,255,000 |
| 01/01/2013 | 65,000 | 342,000 | 663,000 | 1,196,000 | 2,265,000 |
| 01/01/2014 | 62,000 | 324,000 | 661,000 | 1,566,000 | 2,613,000 |
| 01/01/2015 | 60,000 | 307,000 | 635,000 | 3,666,000 | 4,668,000 |
| 01/01/2016 | 55,000 | 286,000 | 658,000 | 5,932,000 | 6,931,000 |
| 01/01/2017 | 48,000 | 260,000 | 646,000 | 8,866,000 | 9,820,000 |
| 01/01/2018 | 40,000 | 227,000 | 612,000 | 11,743,000 | 12,622,000 |
| 01/01/2019 | 36,000 | 205,000 | 594,000 | 15,934,000 | 16,768,000 |
| 01/01/2020 | 31,000 | 183,000 | 569,000 | 18,833,000 | 19,615,000 |
| 01/01/2021 | 28,000 | 158,000 | 542,000 | 20,994,000 | 21,722,000 |
| 01/01/2022 | 25,000 | 138,000 | 482,000 | 22,767,000 | 23,412,000 |
| 01/01/2023 | 22,000 | 122,000 | 413,000 | 25,811,000 | 26,369,000 |
Source(s): TPR: DC Trust: Presentation of scheme return data 2022 to 2023 (Table 2.1)
Financial information
All figures below refer to non-micro schemes and exclude hybrid schemes.
- Reported asset values are now £143 billion, an increase of £29 billion or 26% since last year and 546% since the beginning of 2012 (Table 3.1 and Figure 3 below). Asset changes are made up of contributions (including transfers in) and investment returns. They are reduced by charges, retirements and transfers out.
- Average assets per member have increased since their lowest in 2020, a 11% over the last year, compared to 20% the year before. Overall, average assets per member have fallen by 66% since the beginning of 2012. (see Tables 2.19, 3.1 and Figure 4 below).
- This year, the average assets per membership at retirement was £5,000. This is a 2% decrease since the beginning of last year and 74% decrease since the beginning of 2015 (Table 2.15 and Table 3.4).
- The total amount transferred in to DC schemes increased by 4% last year, from £8.6 billion to £9 billion (Table 3.6). This includes transfers from DB schemes and other DC occupational and personal schemes.
- Contributions increased by 17%, compared to a 4% increase the year before (Table 3.3). These results are not comparable to findings in the ONS Funded Occupational Pension Schemes statistical bulletin which include micro schemes and hybrid schemes.
- In the past year, the total amount transferred out of DC schemes to other workplace or personal pensions has increased from £2.7 billion to £4.1 billion (Table 3.5).
Figure 3: Aggregate reported assets in occupational DC schemes by membership size group (excluding hybrid schemes) (2012 to 2023)
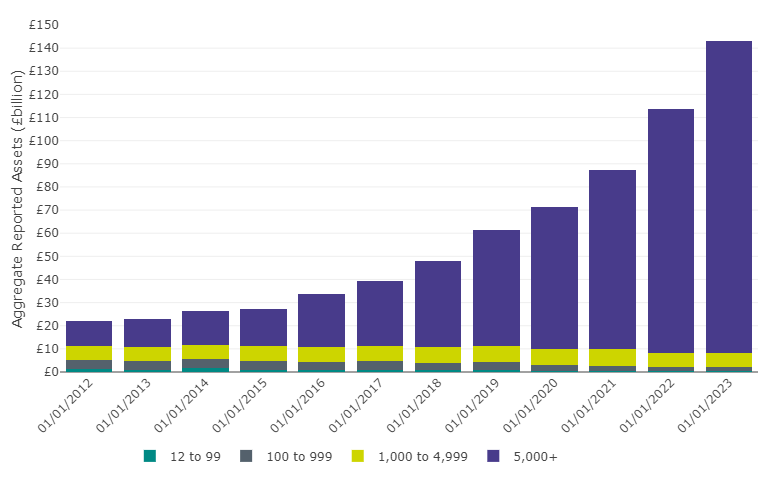
Aggregate asset values are now £143bn, an increase of £29bn or 26% since last year and 546% since the beginning of 2012.
Table 3: Data underlying Figure 3, pertaining to aggregate reported assets in occupational DC schemes by membership size group (excluding hybrid schemes) (2012 to 2023)
| Date | 12 to 99 | 100 to 999 | 1,000 to 4,999 | 5,000+ | Total |
|---|---|---|---|---|---|
| 01/01/2012 | £1,122,000,000 | £4,108,000,000 | £5,872,000,000 | £11,040,000,000 | £22,142,000,000 |
| 01/01/2013 | £1,020,000,000 | £3,821,000,000 | £5,904,000,000 | £12,087,000,000 | £22,831,000,000 |
| 01/01/2014 | £1,759,000,000 | £3,808,000,000 | £6,092,000,000 | £14,812,000,000 | £26,470,000,000 |
| 01/01/2015 | £879,000,000 | £3,776,000,000 | £6,684,000,000 | £15,687,000,000 | £27,025,000,000 |
| 01/01/2016 | £883,000,000 | £3,436,000,000 | £6,398,000,000 | £22,902,000,000 | £33,619,000,000 |
| 01/01/2017 | £884,000,000 | £3,742,000,000 | £6,728,000,000 | £28,095,000,000 | £39,449,000,000 |
| 01/01/2018 | £780,000,000 | £2,985,000,000 | £7,099,000,000 | £37,266,000,000 | £48,130,000,000 |
| 01/01/2019 | £668,000,000 | £3,559,000,000 | £6,953,000,000 | £50,116,000,000 | £61,297,000,000 |
| 01/01/2020 | £559,000,000 | £2,433,000,000 | £6,948,000,000 | £61,312,000,000 | £71,252,000,000 |
| 01/01/2021 | £493,000,000 | £2,310,000,000 | £7,272,000,000 | £77,382,000,000 | £87,458,000,000 |
| 01/01/2022 | £417,000,000 | £1,893,000,000 | £5,788,000,000 | £105,449,000,000 | £113,548,000,000 |
| 01/01/2023 | £336,000,000 | £1,952,000,000 | £5,752,000,000 | £134,985,000,000 | £143,025,000,000 |
Source(s): TPR: DC Trust: Presentation of scheme return data 2022 to 2023 (Table 3.1)
Figure 4: Average assets per membership in occupational DC schemes (excluding hybrid schemes) (2012 to 2023)
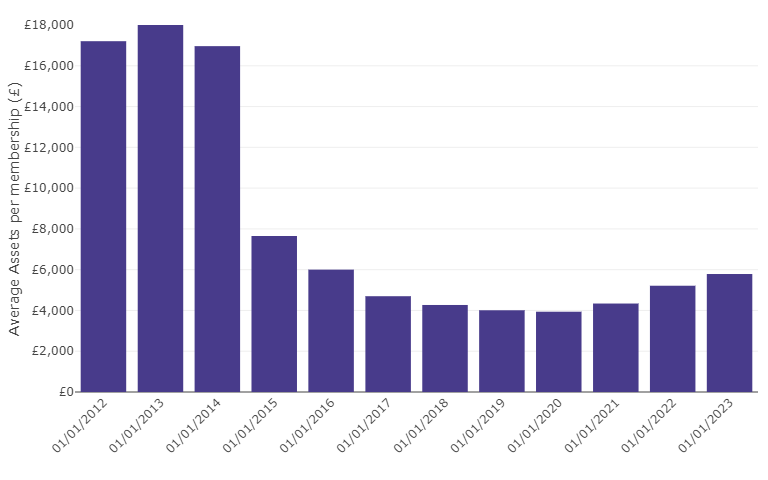
Average assets per membership have increased by 11% over the past year, but overall have fallen by 66% since the beginning of 2012.
Table 4: Data underlying Figure 4, pertaining to average assets per membership in occupational DC schemes (excluding hybrid schemes) (2012 to 2023)
| Date | Average Assets per membership (£) |
|---|---|
| 01/01/2012 | £17,206 |
| 01/01/2013 | £18,008 |
| 01/01/2014 | £16,963 |
| 01/01/2015 | £7,651 |
| 01/01/2016 | £6,002 |
| 01/01/2017 | £4,698 |
| 01/01/2018 | £4,268 |
| 01/01/2019 | £4,009 |
| 01/01/2020 | £3,938 |
| 01/01/2021 | £4,339 |
| 01/01/2022 | £5,212 |
| 01/01/2023 | £5,787 |
Source(s): TPR: DC Trust: Presentation of scheme return data 2022 to 2023 (Table 2.18, 3.1)
Automatic enrolment (AE)
All figures below refer to micro and non-micro schemes, excluding hybrid schemes.
- In the past year, the proportion of schemes being used for AE has remained the same at 2%. This year, 520 schemes were used for AE purposes, a 5% increase since 2016, but a decrease from 570 schemes last year (Table 4.1 and Figure 5 below).
- 98% of memberships are in schemes being used for AE: 24.4 million out of 24.8 million (Table 4.4 and Figure 6 below).
Figure 5: Occupational DC schemes (including micro schemes) being used for automatic enrolment by membership size group (excluding hybrid schemes) (2016 to 2023)
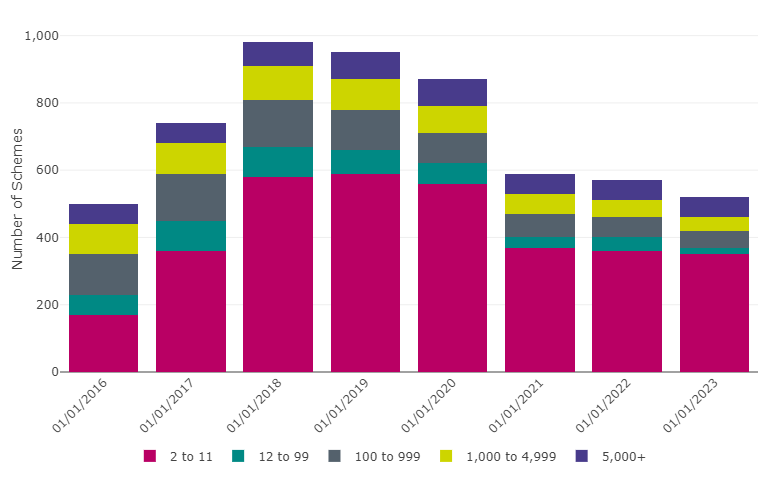
520 schemes are being used for AE, a 4% increase since 2016 but a decrease from 570 schemes last year.
Table 5: Data underlying Figure 5, pertaining to occupational DC schemes (including micro schemes) being used for automatic enrolment by membership size group (excluding hybrid schemes) (2016 to 2023)
| Date | 2 to 11 | 12 to 99 | 100 to 999 | 1,000 to 4,999 | 5,000+ | Total |
|---|---|---|---|---|---|---|
| 01/01/2016 | 170 | 60 | 120 | 90 | 60 | 500 |
| 01/01/2017 | 360 | 90 | 140 | 90 | 60 | 740 |
| 01/01/2018 | 580 | 90 | 140 | 100 | 70 | 980 |
| 01/01/2019 | 590 | 70 | 120 | 90 | 80 | 950 |
| 01/01/2020 | 560 | 60 | 90 | 80 | 80 | 870 |
| 01/01/2021 | 370 | 30 | 70 | 60 | 60 | 590 |
| 01/01/2022 | 360 | 40 | 60 | 50 | 60 | 570 |
| 01/01/2023 | 350 | 20 | 50 | 40 | 60 | 520 |
Source(s): TPR: DC Trust: Presentation of scheme return data 2022 to 2023 (Table 4.1, and from previous DC Trust publications)
Figure 6: Occupational DC scheme memberships (including micro schemes) being used for automatic enrolment by membership size group (excluding hybrid schemes) (2016 to 2023)
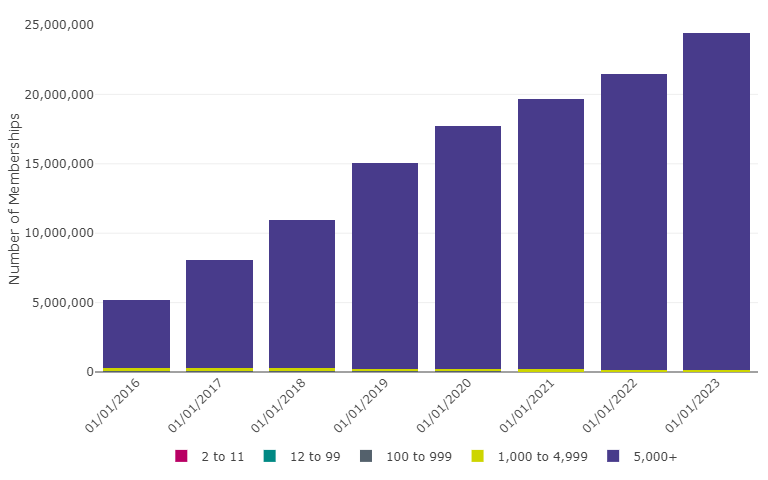
98% of memberships are in schemes being used for AE, and there has been little change since 2017 (97%).
Table 6: Data underlying Figure 6, pertaining to occupational DC scheme memberships (including micro schemes) being used for automatic enrolment by membership size group (excluding hybrid schemes) (2016 to 2023)
| Date | 2 to 11 | 12 to 99 | 100 to 999 | 1,000 to 4,999 | 5,000+ | Total |
|---|---|---|---|---|---|---|
| 01/01/2016 | 1,000 | 2,000 | 57,000 | 223,000 | 4,909,000 | 5,192,000 |
| 01/01/2017 | 1,000 | 3,000 | 58,000 | 212,000 | 7,811,000 | 8,085,000 |
| 01/01/2018 | 2,000 | 3,000 | 58,000 | 225,000 | 10,676,000 | 10,964,000 |
| 01/01/2019 | 2,000 | 3,000 | 52,000 | 193,000 | 14,776,000 | 15,026,000 |
| 01/01/2020 | 2,000 | 2,000 | 41,000 | 187,000 | 17,514,000 | 17,746,000 |
| 01/01/2021 | 1,000 | 1,000 | 30,000 | 162,000 | 19,502,000 | 19,696,000 |
| 01/01/2022 | 1,000 | 1,000 | 27,000 | 128,000 | 21,292,000 | 21,449,000 |
| 01/01/2023 | 1,000 | 1,000 | 24,000 | 99,000 | 24,283,000 | 24,408,000 |
Source(s): TPR: DC Trust: Presentation of scheme return data 2022 to 2023 (Table 4.4, and from previous DC Trust publications)
Micro schemes
All figures below refer to micro schemes, excluding hybrid schemes.
- 87% of micro schemes provided details of their RSS status.
- Of these, 94% identified themselves as an RSS (Table 5.7 and Figure 7 below)[1].
- Of the 1,250 schemes that supplied information on their EPP status, 480 (39%) identified themselves as an EPP.
Figure 7: Micro schemes by RSS status (excluding hybrid schemes) (2016 to 2023)
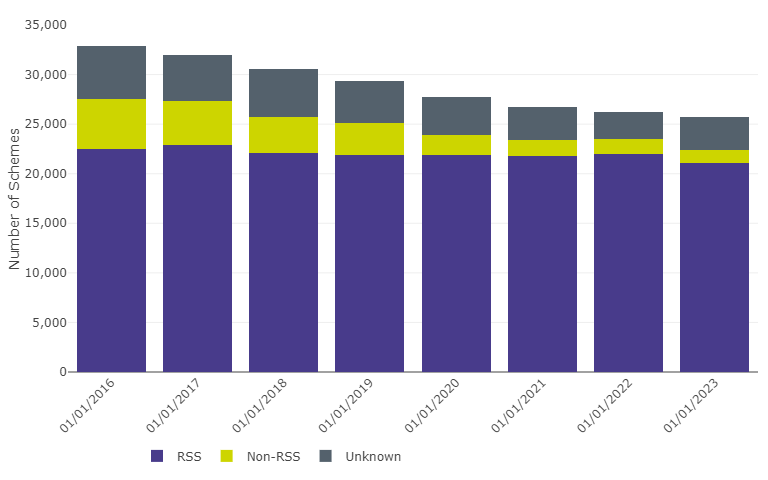
Of those which can be identified, 94% of micro schemes are relevant small schemes (RSS).
Table 7: Data underlying Figure 7, pertaining to micro schemes by RSS status (excluding hybrid schemes) (2016 to 2023)
| Date | RSS | Non-RSS | Unknown | Total |
|---|---|---|---|---|
| 01/01/2016 | 22,500 | 5,050 | 5,330 | 32,880 |
| 01/01/2017 | 22,930 | 4,360 | 4,710 | 32,000 |
| 01/01/2018 | 22,070 | 3,670 | 4,790 | 30,530 |
| 01/01/2019 | 21,930 | 3,200 | 4,220 | 29,340 |
| 01/01/2020 | 21,860 | 2,050 | 3,860 | 27,760 |
| 01/01/2021 | 21,750 | 1,670 | 3,300 | 26,720 |
| 01/01/2022 | 21,970 | 1,520 | 2,770 | 26,260 |
| 01/01/2023 | 21,100 | 1,340 | 3,260 | 25,700 |
Source(s): TPR: DC Trust: Presentation of scheme return data 2022 to 2023 (Table 5.1, 5.7, and from previous DC Trust publications)
The landscape
Table 8 below represents the private pension landscape in the UK, showing at a high level the different forms of employer-sponsored provision available in the private sector, and giving an overview of the size of each type of provision[2]. These data refer to micro and non-micro schemes.
* = Also known as 'true hybrid'. ** = scheme numbers are taken from Annual Survey of Hours and Earnings, Office for National Statistics: rounded estimate of number of jobs where the employee has taken up a workplace group personal or group stakeholder pension. This excludes individual personal pensions.
Table 8: Landscape table
| Defined benefit | Hybrid: mixed benefit* | Hybrid: dual-section | DC (trust) | DC (workplace contract)** | |
|---|---|---|---|---|---|
| Schemes | 4,740 | 240 | 600 | 26,390 | 1,830 |
| Open schemes | 640 | 20 | 260 | 22,750 | 1,450 |
| Total membership | 5,913,000 | 1,105,000 | 4,298,000 | 24,789,000 | N/A |
| Total active members | 440,000 | 238,000 | 889,000 | 10,474,000 | 5,566,000 |
Sources: All figures from TPR’s data based on scheme returns, 31 December 2022 except DC (workplace contract) total active members, from Annual survey of hours and earnings (ASHE) 2021 (published April 2022).
Occupational DC schemes
The table below is an extension of the above table and provides further detail specifically to the occupational DC landscape. It provides a segmentation based on sub-categories where our regulatory intervention varies. For example, master trusts and hybrid schemes are subject to more regulation, while RSS and EPP (see definitions below) have various exemptions from the statutory requirements.
Table 9: Occupational DC scheme breakdown table
| Non-master trust | Master trust | |
|---|---|---|
| Hybrid scheme | 570 | 22 |
| Non-Hybrid scheme | 4,780 | 32 |
| RSS or EPP | 21,590 | 0 |
| Total | 26,940 | 54 |
Source(s): All figures from TPR’s data based on scheme returns, 31 December 2022.
Hybrid schemes
DC trust focuses on schemes in the ‘DC (trust)’ category above, as well as any DC memberships of ‘hybrid: dual-section’ schemes. We do not include data on assets held in DC sections of hybrid schemes, as they include DC additional voluntary contributions (AVCs) and are therefore not comparable to the DC assets figures.
There are many varieties of hybrid schemes, but they can broadly be classed as either mixed benefit or dual-section:
- A mixed benefit scheme offers one set of benefits, which has elements of both defined benefit (DB) and DC schemes; such as a DC scheme with an underpin on a DB basis.
- A dual-section scheme has two sections - one offering DC benefits and the other offering DB benefits.
Contract-based schemes
DC work-based personal pension schemes, also known as contract-based schemes, are excluded from this release, other than in the above table. The term ‘scheme’ here refers to the number of products offered by providers, and not to the number of employers who have bought into those products. These types of scheme consist of:
- Group personal pensions (GPPs)
- Group self-invested personal pensions (GSIPPs)
- Group stakeholder pensions (GSHPs)
DC contract-based schemes are regulated differently from DC trust-based occupational schemes. We work with the Financial Conduct Authority (FCA) in the regulation of contract-based schemes. While contract-based schemes are obliged to register with us, they provide significantly less information than trust-based schemes. As a result, we cannot provide information on total membership of contract-based schemes. To provide landscape context, a figure for the total number of active contract-based members is sourced from the Office for National Statistics (ONS). Beyond that, all types of DC contract-based provision, both group and individual, are outside the scope of this statistics release.
Master trusts
A master trust is defined as an occupational pension scheme that:
- provides money purchase benefits (whether alone or in conjunction with other benefits)
- is used, or intended to be used, by two or more employers
- is not used, or intended to be used, only by employers which are connected with each other
- is not a relevant public service pension scheme
A master trust may also be a group of schemes, none of which are already master trusts, which provide money purchase benefits, and where each scheme in the group is under ‘common control’ with other schemes in the group. We refer to this group of schemes as ‘cluster schemes’ in our master trust code of practice.
Table 10 below provides figures for all master trust schemes with DC members, including those that are micro or hybrid. Sections 2 and 4, the annex of this publication, contain membership numbers for DC master trusts, excluding micro and hybrid schemes.
Table 10: Master trusts table
| Authorised master trusts | |
|---|---|
| Total trusts | 36 |
| Associated open schemes | 50 |
| Active DC memberships | 9,967,000 |
| Reported assets (excluding hybrids) (£) | 105,304,000,000 |
| DC memberships in schemes which reported assets (excluding hybrids) | 23,518,000 |
| Total DC members | 23,680,000 |
Sources: All figures from TPR’s data based on scheme returns, 31 December 2022.
Annex sections
The first three sections of this statistics release, section 1: schemes, section 2: memberships, and section 3: finances, refer to occupational non-micro schemes (except Table 1.1 in section 1). These schemes account for 5% of the total universe of DC schemes[3], but more than 91% of the memberships (see Table 8, Table 1.2 and Table 2.1).
Section 4: AE schemes refer to micro schemes and non-micro schemes.
Section 5: Micro schemes are concerned with schemes of 2 to 11 memberships.
Section 6: Effective date information includes information on the effective dates[4] for data on memberships, contributions and assets.
As at 31 December 2022, nearly all non-micro schemes had an effective date for their membership, contribution and asset data after 31 December 2019. For membership data, this accounts for 98% of schemes and nearly all reported memberships. For contributions and asset data, this accounts for 95% of schemes and nearly all reported contributions (Table 6.1).
For micro schemes, 92% have an effective date for their membership data that is after 31 December 2017; this covers 93% of reported micro memberships. For contribution data, 97% of micro schemes had an effective date after 31 December 2017 (Table 6.2).
Data collection
Pension schemes in the UK with more than one member are required to register with us. At the point of registration, an occupational scheme gives us information including:
- scheme name and contact details
- scheme status (for example, open, closed)
- membership information
- details about the relevant employer(s), trustees and service providers
In addition to registration, we also operate a scheme return process.
The scheme return is how we collect information about occupational pension schemes. We are required to collect scheme return information from each scheme no more than once a year and no less than once every five years. The current practice is for non-micro schemes and hybrid schemes to complete a scheme return annually and micro schemes to complete once every three years.
Scheme returns are submitted using our online reporting tool, Exchange. This offers several advantages, one of which is that schemes can log in to alter their details at any time using the scheme maintenance process.
We ask for more information for non-micro schemes and hybrid schemes in the scheme return than for smaller schemes, such as scheme leaver financial amounts, default investment strategy and decumulation options.
The information in this publication is based on data provided by schemes on returns we issued from July to December 2022 and relates to the levy year 2021-2022 or earlier. Therefore, the figures will not yet reflect all changes in DC memberships through to December 2022.
Relevant small schemes
RSS (a subset of micro schemes) are subject to fewer regulations than other occupational DC schemes, and include schemes formerly known as small self-administered schemes (SSAS). We continue to provide figures in respect of these schemes. See the Definitions section below for more information about their composition.
Executive pension plans (EPPs)
Similar to RSS, EPPs are subject to fewer regulations than other occupational DC schemes. We introduced the EPP question in the scheme return from 2017, and this is the third year that we have provided figures relating to EPPs. See the Definitions section below for more information about their composition.
Only micro schemes that have confirmed they are (or were) not RSS will be asked for this information.
Pensioner members
The data in this publication does not capture all pensioner members. Some members will have retired but transferred out of the scheme. We do however report the number of members for whom the scheme is providing (self-annuitisation) or facilitating (lifetime annuities) the annuity payments.
Calculations
Calculations
In most cases, the data we show here are direct summaries of the data provided to us by schemes via the data collection processes described above (and therefore are not weighted or imputed to account for non-response). However, in some areas we’ve performed some simple calculations to provide more useful information.
Total schemes year-on-year
To create the time series of total schemes year on year (Table 1.1), we start with the total number of DC schemes, with two or more memberships, on the register as at 31 December 2022. We then use a table showing the total number of registrations each year, and the total number of schemes winding up each year. By removing the schemes established during 2022, and adding the schemes that wound up that year, we create an estimate for the number of schemes as at 31 December 2021.
We continue this process back to 1997, the year when the Occupational Pensions Regulatory Authority (OPRA), our predecessor, took responsibility for maintaining the pension schemes register. In the Table 1.18, the number of wind ups and registrations per year is shown dating back to 1988, as there was a significant peak in registrations that year.
Market value of scheme assets
While the significant majority of relevant schemes have provided us with their market value of scheme assets, it is not completed by every scheme. Within the data sections, we’ve shown data for the amount of assets that have been reported to us, as well as the memberships in schemes that have reported an asset figure (Tables 3.1-3.2 and 3.7-3.30). We limit reporting to those asset values whose effective date is no more than three years before 31 of December each year.
To allow users to estimate the total amount of assets in these schemes we’ve provided information to enable average assets to be calculated per member for each scheme size and status banding (where size is based on the number of members) for those schemes who have supplied the information.
Annual contributions (by employer and employee)
The issue for market value of scheme assets is also present for annual contributions. Within the data sections, we’ve shown data for reported contributions and active members in schemes which have reported contributions (Tables 3.3 and 3.31-3.42). We limit reporting to those contribution values whose effective date is no more than three years before 31 December each year. For micro schemes this is five years.
We have used the same method to enable an extrapolated estimate for the total amount of contributions to trust-based DC schemes as for our estimate of assets in such schemes. The difference with respect to contributions is that we provide the active members, rather than all members, as only active members are contributing.
The active members figure could include members who were only active for part of the year.
Governance structure
The governance structure section highlights how the number of master trusts has increased since the introduction of AE. It also separates out non-master trust schemes where most services are provided by a single corporate entity (bundled) and those which have services provided through different corporate entities (unbundled).
The scheme return does not have a question that provides the bundled / unbundled split so, we made an estimate by analysing data provided on the insurer or administrator. Where the same company is listed as both administrator and insurer, we classed this as a bundled scheme. Where the companies are different we classed them as unbundled, and if the administrator is not present or either role could not be derived from the data, we labelled them ‘unknown’.
We incorporated email addresses into this data cleaning process. If a scheme provides an individual’s name as their administrator, we then check the email address for that individual and, if relevant, assign that scheme to the appropriate company.
In addition, it is assumed that all bundled schemes will have an insurer, so where a scheme does not provide an insurer name it is classed as ‘unbundled’.
We have removed the category of ‘industry-wide schemes’ as this is no longer relevant on the basis that such schemes are master trusts following the implementation of the master trust authorisation regime.
Amounts leaving schemes
As with assets and contributions, not all schemes have supplied the amounts leaving schemes. In the data sections (Tables 3.4 to 3.5 and 3.43 to 3.44), we show information for the reported amounts leaving schemes, and the number of members in schemes which have reported their leaver amounts.
Transfers into schemes
As with assets, contributions and leaver amounts, not all schemes have supplied relevant transfer-in data. In the data sections, we show information for the amounts reported to be transferred into schemes (Table 3.6).
It should be noted that where members or amounts are flagged as being transferred this means they have been moved from another workplace pension scheme.
Micro schemes
Some small schemes are exempt from some of the requirements contained in pensions legislation. These are:
Relevant Small Schemes
Previously known as small self-administered schemes (SSAS), relevant small schemes are schemes with fewer than 12 members where all the members are trustees of the scheme and either decisions have to be made unanimously or there is an independent trustee appointed to the scheme who appears on our trustee register. Where there is a sole corporate trustee the above conditions apply in relation to the directors of the corporate trustee. Relevant small schemes represent 21,100 (82%) of micro schemes.
Executive pension plans (EPPs)
EPPs are schemes where a company is the only employer and the sole trustee, at least one third of current directors of the company are members, and all the members are either current or former directors. EPPs represent 480 (2%) of micro schemes.
Within the sub-population of micro schemes, 3,240 schemes have not provided through the scheme return an indication as to whether or not they are a relevant small scheme or an EPP. Of these, 380 schemes have variants within their scheme name that suggest that they might also be an EPP (for example XYZ executive pension plan).
Definitions
Governance structures
Master trust
In the Pension Schemes Act 2017, 'master trust scheme' means an occupational pension scheme which:
- provides money purchase benefits (whether alone or in conjunction with other benefits)
- is used, or intended to be used, by two or more employers
- is not used, or intended to be used, only by employers which are connected with each other, and
- is not a relevant public service pension scheme
Bundled / unbundled scheme
A bundled scheme is one where most services are purchased through a single corporate entity, and an unbundled scheme is one where services are provided through different corporate entities.
Relevant small schemes – formerly known as small self-administered schemes (SSAS)
A relevant small scheme is a scheme where:
- the scheme has fewer than 12 members,
- all members are appointed as trustees to the scheme or all members are directors of the company, which is the sole trustee of the scheme,
- the scheme’s rules provide that any decisions to be made by the trustee(s) are made by unanimous agreement of (a) the trustees who are members of the scheme or (b) directors of the corporate trustee who are members of the scheme, or the scheme has a trustee/ corporate trustee/ director who is independent in relation to the scheme for the purposes of section 23 of the Pensions Act 1995 and is registered on our trustee register.
Executive pension plan (EPP)
An EPP is a scheme:
- in relation to which a company is the only employer and the sole trustee and
- the members of which are either current or former directors of the company and include at least one third of the current directors.
Decumulation options
A scheme offering a lifetime annuity purchases an annuity in the name of the trustees at the point of retirement, and then facilitates payment of that annuity to the member. A scheme offering self-annuitisation will calculate an annuity payment for the member and make the payment to the member directly from scheme funds. Should the member use the fund they have built up to purchase an annuity in their own name then they cease to be a member of the scheme. Pensions drawdown (or income drawdown) is another decumulation option in which the pension is kept invested and the member is able to withdraw an income directly from their pot. We are currently investigating whether data held on the use of pension drawdown can be added to future versions of this publication.
You can find information about decumulation options in section 1: schemes and section 2: memberships.
Scheme status
| Open to new joiners and future service | Closed to new joiners, open to future service | Closed to new joiners and future service | Winding up |
|---|---|---|---|
| New members are allowed to join the scheme | New members are not allowed to join the scheme | New members are not allowed to join the scheme | New members are not allowed to join the scheme |
| Existing members are (or employers) allowed to continue contributing | Existing members are (or employers) allowed to continue contributing | Existing members are (or employers) not allowed to continue contributing | Existing members are (or employers) not allowed to continue contributing |
| Funds continue to be invested | Funds continue to be invested | Funds continue to be invested | Funds continue to be invested |
| Funds continue to attract charges | Funds continue to attract charges | Funds continue to attract charges | Funds continue to attract charges |
Member status
| Active | Deferred | Pensioner |
|---|---|---|
| In relation to an occupational pension scheme, means a person who is in pensionable service under the scheme, | In relation to an occupational pension scheme, means a person (other than an active or pensioner member) who has accrued rights under the scheme | In relation to an occupational pension scheme, means a person who in respect of his pensionable service under the scheme or by reason of transfer credits, is entitled to the present payment of pension or other benefits |
| Funds continue to be invested | Funds continue to be invested | Funds can remain invested if the scheme operates a decumulation option |
| Funds continue to attract charges | Funds continue to attract charges | Funds can continue to attract charges if the scheme operates a decumulation option |
The number of memberships does not equate to the number of individuals, as one individual can have multiple memberships.
Dependants
In DC schemes which operate self-annuitisation or lifetime annuities, a member may have the option to purchase a joint life annuity. In this case, a nominated dependant will receive a proportion of the member’s retirement income for the rest of their life, should the member die before the dependant. Membership figures collected reflect those members who are relevant for calculation of the pension levy. As dependants are not included in this they are not reported to us and so dependants are not included in the statistics in this release.
Footnotes
[1] These figures exclude 3,260 schemes which have not yet answered the RSS question in scheme return.
[2] For the purposes of this document, our remit extends to all private sector pensions where an employer facilitates contribution payments, and therefore our figures exclude personal pensions where an individual has purchased a product directly from a provider and there is no direct payment arrangement.
[3] Where the universe refers to all occupational DC or hybrid schemes with two or more DC memberships (excludes workplace contract).
[4] The term effective date in this context (and in section 6 generally) refers to the date supplied with the information by respondents. For instance, if a scheme counts its members on 1 April 2014, and then reports this figure to us on 1 May 2014, the effective date will be 1 April 2014.